


2026 State of B2B Technical Sales
Founder of Salescycle, Joe Delfino, shares how modern sales is about investing in people {% module_block module...
2 min read


Organizations in every industry are undergoing change initiatives, whether market-driven, customer-driven, or operational. To succeed, you’ll need employee engagement and support for well-defined, measurable goals. That’s where dashboards come in.
Dashboard reporting hits on some of the major trends in many industries today:
But at the heart of it, it’s about clarity. And clear is kind. To best support your employees through an organizational transformation, you will need to connect the dots between their work, impact on the customer, and overall business goals. Shared KPIs on a visible dashboard can help accomplish this.
In some companies we work with, digital transformation is creating the opportunity and the need for more meaningful, integrated dashboards; while in others, the reverse is true: they’re moving more and more of their activities to digital dashboards to increase transparency.
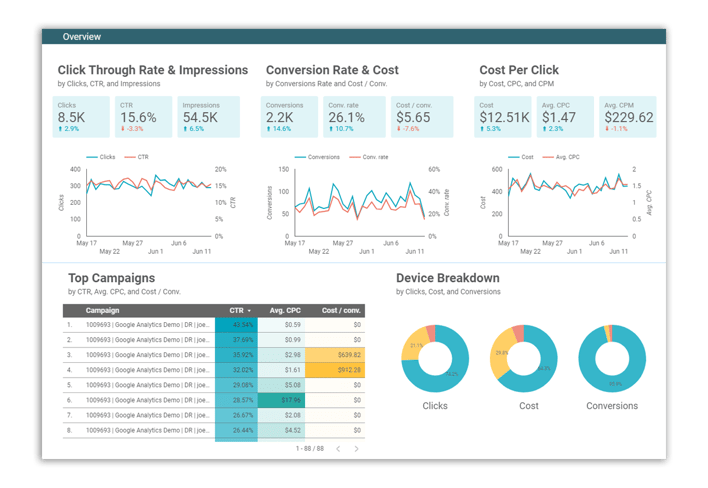
One recent example: in aligning multiple sales teams around a new sales process, we’ve implemented a CRM, sales, and marketing platform that now allows for a single shared dashboard and forecasting.
In another, the integration of their CRM and ERP allows for a single, company-wide dashboard on safety, quality, and revenue.
A few things we’ve learned along the way:
Clear, actionable reporting can be easier—but it can create challenges in people, process, and technology. Download our Digital Transformation guide for practical tips on overcoming top challenges.


Founder of Salescycle, Joe Delfino, shares how modern sales is about investing in people {% module_block module...

Key Takeaways: The semiconductor market is entering a production-scale growth phase, driven by AI infrastructure and advanced packaging. US fab...

Updated June 2026 Whether you’re a startup working through a product launch or a large enterprise operating a small division, there will probably...